Making Evaluations: Copymaster 1 Lunchtime Places
Learning Intention: We are learning to analyse and discuss data display.
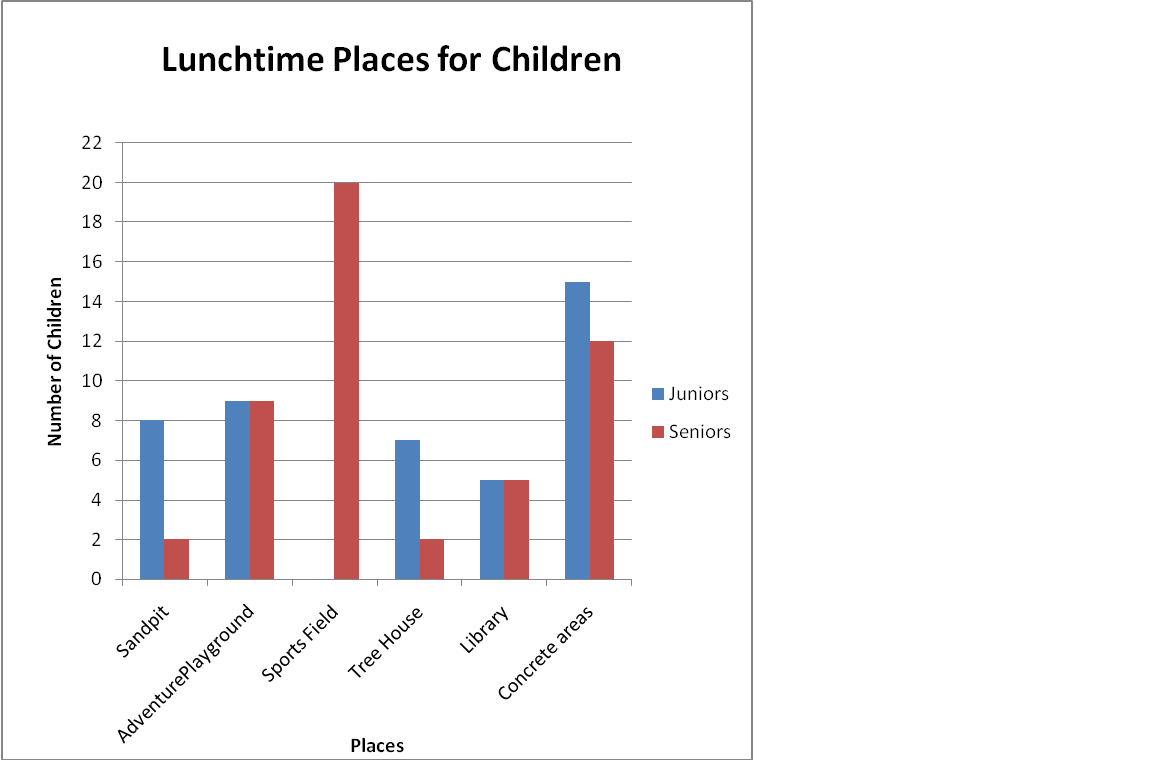
“The teachers at Sunshine school wanted to know where the most children play at lunchtime. After one lunchtime they asked all the children where they had spent most of the lunchtime and made a bar graph.
After analyzing the data, I discovered that there were 94 children participating in the survey. Of this number, 45 were juniors and 46 were seniors. The most popular area for the seniors was the sports field, the least popular area was the concrete.
No comments:
Post a Comment
Note: only a member of this blog may post a comment.